Tag Archive for: statistics

Today we’ll look at numbers.  Yes, more fun with statistics.  Not crime stats like I wrote about a couple of weeks ago, but what Americans overall think about crime stats.

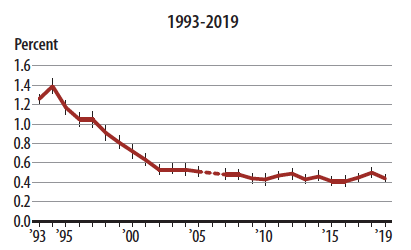
Most students in most of my classes initially think the rate of crime has gone UP over the past 25 years. At the beginning of class we do a little “pop quiz” about beliefs around crime rates and violence. When asked, the majority who thought the rate of violence had gone up cite the prevalence of violence in the media. The Gallop Poll too tracks this kind of opinion but in a more rigorous way and over the nation; they’ve found that most Americans believe the rate of crime nationally has gone up just about every year over the past 25 years. For instance, in 2016, 70% of respondents believed there was more crime in the US than there had been the prior year. Despite the fact that the actual rate of crime has gone DOWN overall over the past 25 years. The most dramatic drop, BTW, was seen between 1993 and 2000.

A couple of more numbers: Back to 2016, 60% of Americans said that the crime rate was either “extremely” or “very” serious, and 79% reported that they worried about the rate of crime and violence. Yet in that same year only 14% of Americans felt that the rate of crime in their area, where they lived, was either “extremely” or “very” serious.  You can find these numbers, and many many more, at https://news.gallup.com/poll/1603/crime.aspx.  These Gallop people have serious fun with statistics.

Why do so many of our neighbors believe the crime rate is increasing when it was in fact decreasing? The prime suspect is likely mass media reporting. Violence sells, violence leads, and in our current 24/7 news cycle over myriads of channels, the theme of violence gets ingrained. Something repeated over and over and over, true or not, seems to take on a life of its own.

This is not news. This was discussed decades ago, before there were hundreds of TV channels, cable channels, and social media to disseminate highly lucrative disinformation. Crime sells.

Way back in the 1970s, Dr. George Gerbner at the University of Pennsylvania put forward “cultivation” or “mean world theory,” proposing that prolonged exposure to violence on television gives rise to increased fear of crime and a view that the world is a more dangerous place than it really is.

Gerbner testified before a US House of Representative Subcommittee in 1981 about possible political effects:

“Fearful people are more dependent, more easily manipulated and controlled, more susceptible to deceptively simple, strong tough measures and hard-line postures,” Gerbner said in 1981. “They may accept and even welcome repression if it promises to relieve their insecurities. That is the deeper problem of violence-laden television.”

https://www.hollywoodreporter.com/news/general-news/study-tv-violence-linked-mean-712890/

And it’s not just the news, fictional programs too contribute to this “mean world” approach. How about social media?

Back to the beginning — what do Americans think of crime stats? Mostly we don’t.  Most people are uninformed, rely on information several times removed from sources, and spun to sell something.

Are better sources hard to find? No. And I’ll leave it at that today.

Today is Wednesday, May 5, the year is 2021. And I’m gonna geek out on safety stats today.

I began training in Karate in November 1992 — which is a long time ago, 28.5 years in fact — and that also began my education in self-defense. I began training at the Feminist Karate Union, which was founded in 1971 — an even longer time ago, 50 years — by an intrepid and driven feminist named Py Bateman. It began not as a Karate school, but as a self-defense class at the University of Washington. At that time, rates of assault were really quite high. Py Bateman not only teased out physical techniques from traditional Karate that just about anyone could learn quickly, but also worked with UW faculty on what we’d now call assault dynamics. You know, all that gooey and squishy psychological and social stuff that impacts how we react to threats. Sometimes it convinces us that we really can’t fight back, sometimes it kicks us into high gear to kick butt.  But I’m digressing . . .

So in the 1990s, and beyond, I read quite a few books about self-defense. One thing I noticed is how many of them somewhere towards the beginning stated “the rate of violent crime is increasing.” And there was nothing, no footnote or citation, given to back that up! Even today, a lot of blogs or social media or so-called e-news lists still make that blanket claim. A couple of decades ago I wondered if the rate of violence really was going up that much year after year after year. So I decided to do a little checking. And I found that the rate of violence in the US has been in decline. Since 1993.

In my longer classes I do discuss a couple of relevant statistics. My main source is the Bureau of Justice Statistics. Each year they survey a representative sampling of the American population, asking if specific violent crime happened to them.  (The one area they don’t speak to is homicide, as the deceased don’t respond to surveys.)  The main benefit of the BJS is that they also ask if victims reported the crime to police. So we also get some idea on rates of crime, whether reported or not, as well as better numbers on overall violence.

Now I didn’t want to be THAT self-defense teacher who got stuck in a time warp and never updated my figures and just relied on what most others repeated over and over.   Hence geeking out on safety stats.  Every couple of years I go back and look at the current numbers. Because they change over time, and I owe students the most accurate information available to me.  So, as I said, I’m gonna geek out a bit on the stats.

Geeking out on safety statistics: graph of rate of violent crime in USA, 1993-2019

Percent of US residents age 12 or older who were victims of violent crime excluding simple assault

The overall rate of violence in the US of A has indeed been in decline since 1993. Most of that decline happened over the 1990s into the early 2000s. Since then it’s mostly been comparatively flat-ish, a mild downward slope with some variation year by year. However, there seems to have been a bump upward in homicides the last year or two, and there may be the beginnings of an uptick in overall violence. Is it another variation, or a trend? We won’t know for several years.

Other relevant stats:

  • Who’s assaulted more often, men or women?
  • Are men more likely to be assaulted by strangers or by people they know? and
  • Are women more likely to be assaulted by strangers or by people they know?

For just about all of the years since 1993, the answer to Q1 is MEN. However, the difference had been narrowing over time. And it may just be that in 2015, 2017 and 2018, women had been more often victims of assault than had men. By a very small margin, and I don’t know if that difference is considered statistically significant, but they are getting even.

Are men more likely to be assaulted by strangers or people they know? Earlier on the answer would have been strangers. But those two figures also have not only been declining but have been getting closer. And some years, such as 2015 and 2017, they are VERY close. Apparently a number of statisticians are currently saying it’s about even, that the difference is statistically insignificant.

In case you haven’t heard the phrase “statistically insignificant,” it means that because we are not counting each and every individual in the US there’s some room for error.  Statisticians calculate what they expect the error may be, and the difference between two numbers, if small, may reflect not a real difference but just that expected margin of error.

Finally, are women assaulted more often by strangers or by people they know? This is the one super-consistent finding. Women are far more likely to be assaulted by people they know. Way back in the 1990s, through the 2000s, and 2010s.

The BJS has a nifty web tool, the National Crime Victimization Survey Victimization Analysis Tool.  Using this, you can quickly sort through their database of statistics to look at specific figures.  I used it to sort through the data to find numbers of all assaults committed against men and against women by categories of assailants (intimate partner, other family, friend or acquaintance, stranger, unknown).  I then repeated the process three more times, narrowing down the assault types to sexual assault, then aggravated assault, and robbery.  You too can do this.

And of course I’m providing a link or two for your own review. I’m not expecting you to just take my word for it. I encourage students to develop a basic understanding of how scientists interpret numbers taken from real lives and apply them back. Please do take a look, at least at some summary pages.

Stay safe, and live life.